Threat Detection and Response
Real-time Threat Detection and Response
Stay steps ahead of cyber threats with our cutting-edge threat detection and response solution. Monitor, intercept, and respond instantly to protect your cloud infrastructure from evolving cyber threats.

Cloud Security Risk Assessment
Find out which misconfigurations are lurking in your cloud
No Threat in the Cloud
Fear No Threat in the Cloud: Identify, Investigate, and Respond in Real-time
Unified Threat Visibility
Activity Monitoring
Rapid Investigation
Our Comprehensive Approach to Implementing Container Vulnerability Management

AI/ML-Driven Cloud Security Insights
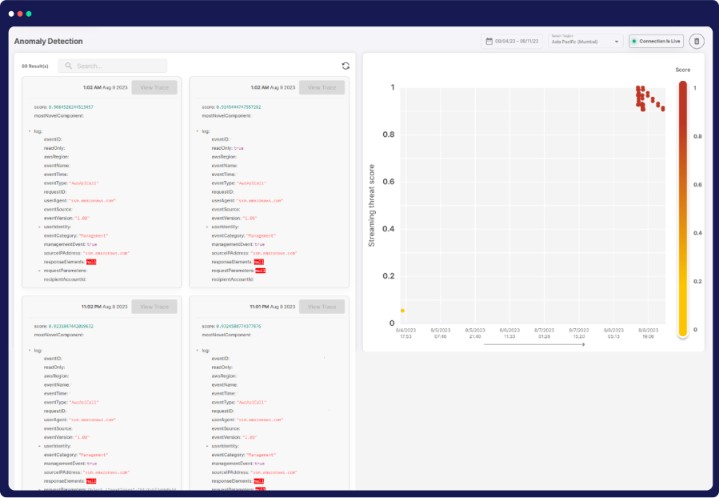
Advanced Anomaly Detection
Leverage ML to proactively identify network anomalies and zero-day attacks, minimizing false positives.
Reconnaissance Detection
Detect and address common reconnaissance techniques, ensuring ports remain secure.
Adversary Activity Spotting
Identify evasive activities used by adversaries in their quest for sensitive data, like PII and financial information.
DNS Threat Identification
Uncover DNS-based threats, such as domain generation algorithm (DGA), without altering your DNS infrastructure.
Advanced Cloud Security through UEBA
Advanced UEBA
Continuously monitor user activities, pinpointing abnormal behavior for swift threat response.
Anomaly Detection
Identify irregular compute provisioning, safeguarding against resource misuse and cryptojacking.
Insider Threat Alert
Uncover suspicious activities like excessive login failures, thwarting brute force attacks.
Real-time User Behavior
Instantly spot specific actions, backed by historical context, for a proactive security stance.


Comprehensive Cloud Security Solutions Suite
Risk-Based Prioritization
Effortlessly prioritize threats by overlaying detections with infrastructure context, ensuring the protection of your most valuable resources in the cloud.
Graph-Driven Investigation
Understand detection impact using our Security Graph, correlating it with network, identity, and secret risks for a comprehensive view of your environment's security posture.
End-to-End Visibility
Automatically correlate threats across real-time signals, cloud activity, and audit logs to uncover attacker movements, enabling rapid response to mitigate potential incidents.
Holistic Application and API Security
Advanced Attack Simulation
Gain a comprehensive understanding of attacker behavior by analyzing external exposure. Augment investigations with real-time attacker views.
Risk Validation & Prioritization
Verify the exposure status of ports and IP addresses in your cloud network configurations. Swiftly prioritize and remediate high-risk issues with valuable context.
API Configuration Auditing
Secure your environment by identifying misconfigured APIs. Receive alerts for unauthenticated access, secret exposure, or sensitive data exposure, reducing your attack surface.


